
 Radware Application Performance Monitoring (APM)
Ensures Continuous, Optimized Web Applications Performance
Click here to jump to more pricing!
Overview:
In today's online business landscape, fast-performing applications is one of the top priorities. Cutting-edge acceleration solutions, such as Radware's FastView, result-driven Web Performance Optimization (WPO) technology embedded into the Alteon Application Delivery Controllers (ADC), offers a holistic approach addressing the various aspects impacting Web applications' performance.
However, while it is crucial to have the right technology to accelerate Web application performance, it is not enough. Since Web applications continuously change and evolve, Web application performance optimization is not a one-time effort but rather an on-going approach. In fact, in order to detect any application performance issues in real-time before your customers experience them, it is essential to have an end-to-end monitoring solution which provides complete visibility of your applications performance to ensure they meet SLA at all times.
What Does Application Performance Monitoring Do?
Radware's Application Performance Monitoring (APM) allows you to detect application performance issues – before your customer does. Application Performance Monitoring ensures Web application performance meets your customer's expectations and consistently delivers their business SLA.
APM is an end-to-end monitoring solution that assures full application SLA. It provides complete visibility into your applications' performance with a breakdown by application, location or specific transaction. APM allows you to proactively maintain application performance and protect SLAs with real-time error detection and the ability to track real user transactions and response time. This application monitoring provides historical reports with drilldown-able granular analysis based on user-defined SLA, while providing measurements of the delay per each application delivery chain segment, including data center time, network latency and browser rendering time.'s ERT is involved in mitigating an attack, a full post attack analysis report is provided.
What Makes Application Performance Monitoring (APM) Better?
APM is the leading tool to manage and track application SLAs using historical reports with fast root cause analysis using highly granular measurements. It provides a bird's eye view which covers all applications, transactions, users and data centers – allowing drill-down to the user, application or transaction level. In addition, this application monitoring allows the extraction of performance information from the end-user devices to reflect actual end-user QoE - wherever the clients are, at all times.
The performance measurements are based on user-defined SLA and may include the minimum average response time the application should provide, the % of errors and user experience. The SLA can be also drilled down to the geo-location level, allowing administrators to determine if there's a problem with users from a specific region.
In addition, it is very easy to deploy and activate APM. It has a short time to operation with a simple enable button to activate—nothing more. No scripting or complex agent integration is required.
Radware's Application Performance Monitoring
To ensure Web application performance meets your customer's expectations and consistently delivers their business SLA, one must gain visibility on both application performance and on the actual Quality of Experience (QoE) end-users are experiencing. Radware provides a new Application Performance Monitoring (APM) module, unleashing an end-to-end, proactive approach for monitoring and maintaining a high SLA of Web portals as well as mission-critical applications. Radware's APM provides the following key values:
- Complete visibility of Web application performance based on user-defined SLA
- Fast Root Cause Analysis via highly-granular measurement, in real-time
- Monitoring of actual user traffic, with no dedicated scripts per web application, lowering costs
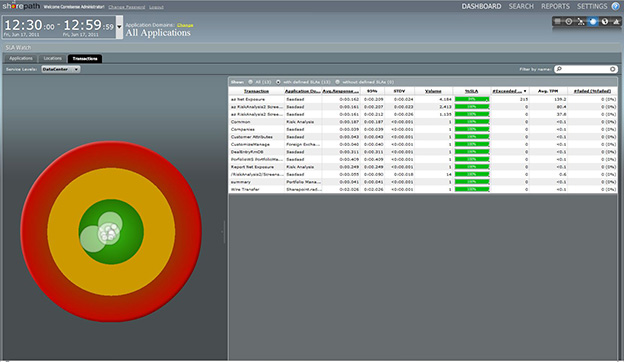
Complete Application Performance Insight Based on User-defined SLA
Radware's APM provides a bird's eye view which covers all applications, transactions, users and data centers – allowing users to drill-down to the user level or even application and transaction level. In addition, it allows the extraction of performance information from the end-user devices to reflect actual end-user QoE - wherever the clients are, at all times. The performance measurements are based on user-defined SLA and may include the minimum average response time the application should provide, the % of errors and user experience. The SLA can be also drilled down to the geo-location level, allowing administrators to determine if there's a problem with users from a specific region.
Application SLA Summary View
Fast Root Cause Analysis via Highly-Granular Measurement
Radware's APM enables fast, accurate troubleshooting and rapid root cause analysis in case of application delays. This is achieved due to a detailed transaction measurement breakdown across a 3-stage application delivery chain, as follows:
- Server to ADC response time – the time spent in the data center
- Network time – the time it takes for the server response to reach the client
- Browser rendering time – the time it takes the browser to render and display the page
This transaction breakdown enables users to efficiently pinpoint the origin of application performance degradation, saving analysis time and effort.
Monitoring Actual Transactions & Errors of Real Users
Radware's APM measurements are based on real user transactions, as opposed to synthetic-based transaction monitoring. In addition, the solution's analytics engine also captures actual errors of actual users that run real-life scenarios. As a result, there is no need to write dedicated scripts per web application or simulate synthetic transaction, ultimately lowering overhead, risk and costs.
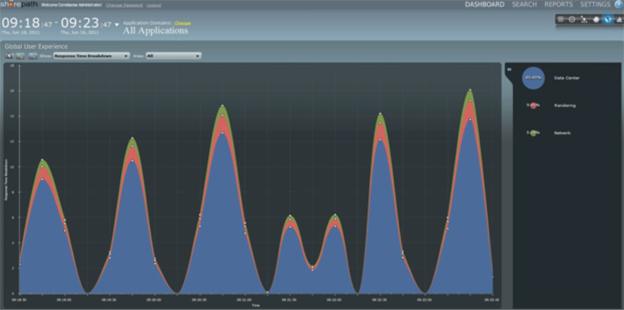
Transaction Stage Breakdown Analysis
Features and Benefits:
Real user experience application monitoring tool
- Actual user transaction, full page coverage – no predefined scripts on predefined URLs
- Natural support – for secured pages
- Actual user's locations – no dependency on agents
Zero deployment and maintenance
- Seamless integration with application deployment infrastructure
- No change to Web pages / Web applications / Web Servers
- Instance sync with web application update
Support for both internal and external applications
- Real time monitoring vs. sampling time
- Monitoring of real server availability
- Instant troubleshooting
Documentation:
Download the Radware Application Performance Monitoring (APM) Datasheet (PDF).